Custom colors for desmos
Use custom colors and more in Desmos to beautify your graphs
Hvad er Custom colors for desmos?
Custom colors for desmos er en Chrome-udvidelse udviklet af ElFisho Dev, og dens hovedfunktion er "Use custom colors and more in Desmos to beautify your graphs".
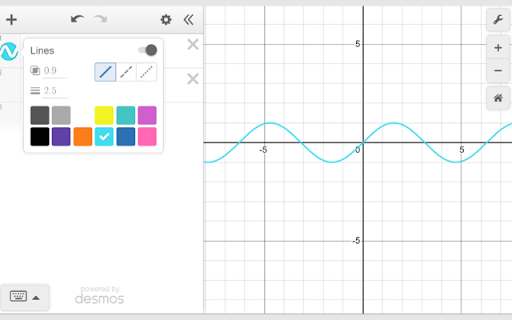
Udvidelsesskærmbilleder


Download Custom colors for desmos-udvidelses-CRX-fil
Download Custom colors for desmos-udvidelsesfiler i crx-format, installer Chrome-udvidelser manuelt i browseren eller del crx-filer med venner for nemt at installere Chrome-udvidelser.
Brugsanvisning til Udvidelsen
                        This extension allows for several changes to Desmos graphing calculator including:
- change the 9 default Desmos colors to 12 custom colors
- Advanced Styling (add a text outline to labels and/or make them editable)
- Show/hide/create hidden folders

Add any color you want to the menu to make your graphs more informative and colorful!  Please enjoy and feel free to suggest feedback.

v0.0.4 fixed a compromising bug and changed the number of colors from 9 to 12
Grundlæggende oplysninger om udvidelsen
| Navn |  Custom colors for desmos Custom colors for desmos |
| ID | clcdbeolcdigfefgbhlgghepjfkpdlgi |
| Officiel URL | https://chromewebstore.google.com/detail/custom-colors-for-desmos/clcdbeolcdigfefgbhlgghepjfkpdlgi |
| Beskrivelse | Use custom colors and more in Desmos to beautify your graphs |
| Filstørrelse | 42.99 KB |
| Antal Installationer | 3,297 |
| Nuværende Version | 0.0.4 |
| Senest Opdateret | 2021-12-08 |
| Udgivelsesdato | 2020-10-18 |
| Bedømmelse | 3.60/5 Samlet 5 Bedømmelser |
| Udvikler | ElFisho Dev |
| [email protected] | |
| Betalingsmetode | free |
| Udvidelseswebsted | https://www.desmos.com/calculator |
| Understøttede Sprog | en |
| manifest.json | |
{
    "update_url": "https:\/\/clients2.google.com\/service\/update2\/crx",
    "name": "Custom colors for desmos",
    "version": "0.0.4",
    "manifest_version": 2,
    "description": "Use custom colors and more in Desmos to beautify your graphs",
    "homepage_url": "http:\/\/desmos.com\/calculator",
    "icons": {
        "16": "icons\/icon16.png",
        "48": "icons\/icon48.png",
        "128": "icons\/icon128.png"
    },
    "default_locale": "en",
    "background": {
        "scripts": [
            "src\/bg\/background.js"
        ],
        "persistent": true
    },
    "content_security_policy": "script-src 'self' https:\/\/cdn.jsdelivr.net\/npm\/@shoelace-style\/[email protected]\/dist\/shoelace\/; object-src 'self'",
    "page_action": {
        "default_icon": "icons\/icon19.png",
        "default_title": "page action demo",
        "default_popup": "src\/page_action\/page_action.html"
    },
    "permissions": [
        "https:\/\/www.desmos.com\/*"
    ],
    "content_scripts": [
        {
            "matches": [
                "https:\/\/www.desmos.com\/*"
            ],
            "js": [
                "src\/inject\/content_script.js"
            ],
            "run-at": "document-end"
        }
    ]
} | |