Information Visualization of Browser History
Reads your history, and use information visualization techniques to show graphically how you spend your time on the internet.
Was ist Information Visualization of Browser History?
Information Visualization of Browser History ist eine Chrome-Erweiterung, die von ap.giancarlo entwickelt wurde, und ihr Hauptmerkmal ist "Reads your history, and use information visualization techniques to show graphically how you spend your time on the internet.".
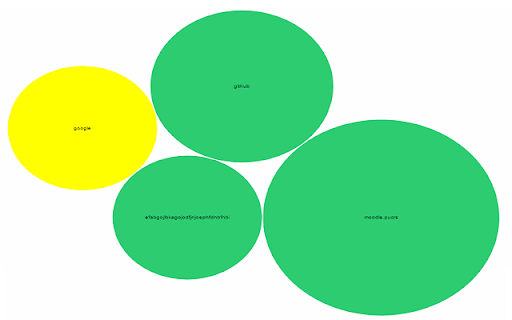
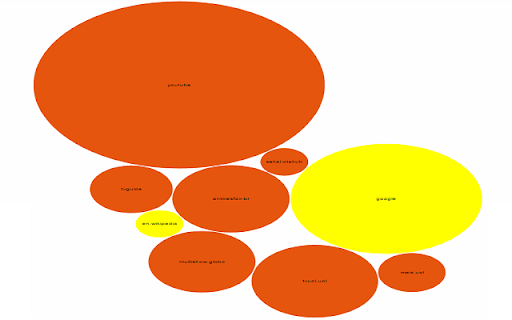
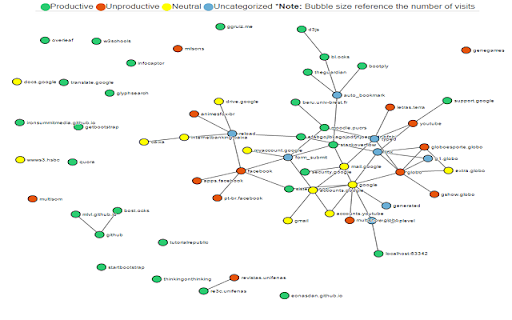
Erweiterungsscreenshots


Information Visualization of Browser History-Erweiterungs-CRX-Datei herunterladen
Laden Sie Information Visualization of Browser History-Erweiterungsdateien im crx-Format herunter, installieren Sie Chrome-Erweiterungen manuell im Browser oder teilen Sie die crx-Dateien mit Freunden, um Chrome-Erweiterungen einfach zu installieren.
Anleitung zur Verwendung der Erweiterung
Reads your browser history, and use Information Visualization techniques (a branch of Computer Graphics), to show graphically how you spend your time on the Internet to analyze if you are productive or unproductive when using the Internet. According to a research done by Salary.com with ten thousand employees, most of them waste time on the Internet in websites unrelated to their work. The inefficient use of time by these employees during their working day costs to the US companies the equivalent of US $ 759 billion per year. The main distraction was the Internet activity indicated by 44.7% of respondents, generating a cost of around US$ 300 billion annually to companies. Thus, companies may adopt a measure to reduce this idle time with this software. This extension is not a tracking software, but a software to make a self-analysis to see where you are spending your time on the Internet, see the most visited websites, the behaviour on specific days by adding a date time filter, the behavior when clicking on links, like ads, and see the frequency of use of the internet and what are the accessed websites. The visual charts help to analyse the browser history, since lots of data are difficult to analyse in a text form. With this visual charts, you can see where you can improve your productivity. Grundlegende Informationen zur Erweiterung
| Name |  Information Visualization of Browser History Information Visualization of Browser History |
| ID | onlpodkdakgonlmodbgapcbigpcimokd |
| Offizielle URL | https://chromewebstore.google.com/detail/information-visualization/onlpodkdakgonlmodbgapcbigpcimokd |
| Beschreibung | Reads your history, and use information visualization techniques to show graphically how you spend your time on the internet. |
| Dateigröße | 13.3 MB |
| Installationsanzahl | 371 |
| Aktuelle Version | 1.0 |
| Letztes Update | 2015-11-27 |
| Veröffentlichungsdatum | 2015-11-26 |
| Bewertung | 3.75/5 Insgesamt 4 Bewertungen |
| Entwickler | ap.giancarlo |
| Zahlungsart | free |
| Unterstützte Sprachen | en |
| manifest.json | |
{
    "update_url": "https:\/\/clients2.google.com\/service\/update2\/crx",
    "manifest_version": 2,
    "name": "Information Visualization of Browser History",
    "version": "1.0",
    "description": "Reads your history, and use information visualization techniques to show graphically how you spend your time on the internet.",
    "icons": {
        "16": "icons\/grafico-16.png",
        "48": "icons\/grafico-48.png",
        "128": "icons\/grafico-128.png"
    },
    "browser_action": {
        "default_title": "InformationVisualizationofBrowserHistory",
        "default_icon": "icons\/grafico.png"
    },
    "author": "GiancarloPeccinandEduardoBissigo",
    "background": {
        "scripts": [
            "modules\/interface\/views\/main.js"
        ],
        "persistent": false
    },
    "permissions": [
        "history",
        "storage"
    ]
} | |