Information Visualization of Browser History
Reads your history, and use information visualization techniques to show graphically how you spend your time on the internet.
什麼是Information Visualization of Browser History?
Information Visualization of Browser History是由ap.giancarlo開發的Chrome擴展程式,該擴展的主要功能是“Reads your history, and use information visualization techniques to show graphically how you spend your time on the internet.”。
擴展截圖


下載Information Visualization of Browser History擴展crx文件
下載Information Visualization of Browser History擴展crx格式的文件,手動將Chrome擴充功能安裝到瀏覽器中,也可以將crx文件分享給朋友,輕鬆安裝Chrome擴充功能。
擴展使用說明
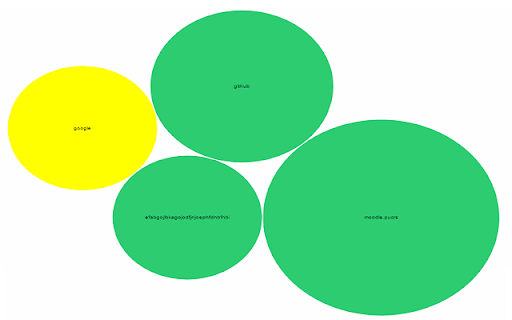
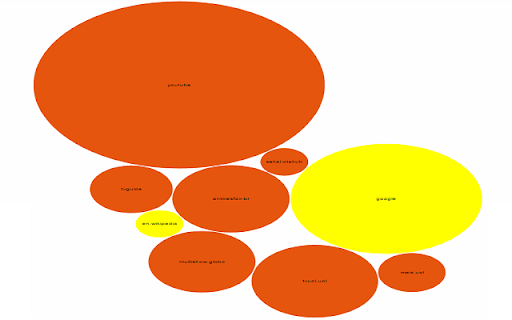
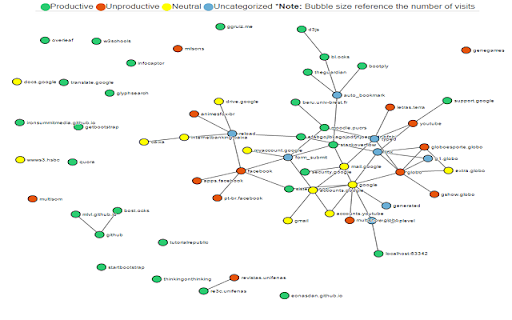
Reads your browser history, and use Information Visualization techniques (a branch of Computer Graphics), to show graphically how you spend your time on the Internet to analyze if you are productive or unproductive when using the Internet. According to a research done by Salary.com with ten thousand employees, most of them waste time on the Internet in websites unrelated to their work. The inefficient use of time by these employees during their working day costs to the US companies the equivalent of US $ 759 billion per year. The main distraction was the Internet activity indicated by 44.7% of respondents, generating a cost of around US$ 300 billion annually to companies. Thus, companies may adopt a measure to reduce this idle time with this software. This extension is not a tracking software, but a software to make a self-analysis to see where you are spending your time on the Internet, see the most visited websites, the behaviour on specific days by adding a date time filter, the behavior when clicking on links, like ads, and see the frequency of use of the internet and what are the accessed websites. The visual charts help to analyse the browser history, since lots of data are difficult to analyse in a text form. With this visual charts, you can see where you can improve your productivity. 擴展基本資訊
| 名稱 |  Information Visualization of Browser History Information Visualization of Browser History |
| ID | onlpodkdakgonlmodbgapcbigpcimokd |
| 官方網址 | https://chromewebstore.google.com/detail/information-visualization/onlpodkdakgonlmodbgapcbigpcimokd |
| 簡介 | Reads your history, and use information visualization techniques to show graphically how you spend your time on the internet. |
| 檔案大小 | 13.3 MB |
| 安裝次數 | 371 |
| 目前版本 | 1.0 |
| 更新時間 | 2015-11-27 |
| 上架時間 | 2015-11-26 |
| 評分 | 3.75/5 共 4 次評分 |
| 開發者 | ap.giancarlo |
| 付費類型 | free |
| 支援的語言 | en |
| manifest.json | |
{
    "update_url": "https:\/\/clients2.google.com\/service\/update2\/crx",
    "manifest_version": 2,
    "name": "Information Visualization of Browser History",
    "version": "1.0",
    "description": "Reads your history, and use information visualization techniques to show graphically how you spend your time on the internet.",
    "icons": {
        "16": "icons\/grafico-16.png",
        "48": "icons\/grafico-48.png",
        "128": "icons\/grafico-128.png"
    },
    "browser_action": {
        "default_title": "InformationVisualizationofBrowserHistory",
        "default_icon": "icons\/grafico.png"
    },
    "author": "GiancarloPeccinandEduardoBissigo",
    "background": {
        "scripts": [
            "modules\/interface\/views\/main.js"
        ],
        "persistent": false
    },
    "permissions": [
        "history",
        "storage"
    ]
} | |